Usain Bolt reached a speed of 27.8 mph at the 2009 World Championships in Berlin. But, what’s the average human athlete running speed?
Before diving into that question, let’s appreciate just how fast Usain Bolt really is. His top speed is faster than some average car speeds in cities across California, according to Google Maps’ data:
- Sacramento: 31.5 mph
- San Diego: 31 mph
- San Jose: 28 mph
- Los Angeles: 26.8 mph
- San Francisco: 18 mph
Taking the average of these car speeds, we get 27.06 mph, which Bolt just manages to surpass. And if that wasn’t impressive enough, at the 2008 Olympic Games in Beijing, he broke the 100-meter world record with a time of 9.69 seconds, running at 27 mph for a good chunk of the race!
| Race Segments (meters) | Speed (mph) |
|---|---|
| 0 to 10 | 12.09 |
| 10 to 20 | 21.93 |
| 20 to 30 | 24.58 |
| 30 to 40 | 25.71 |
| 40 to 50 | 26.32 |
| 50 to 60 | 27.28 |
| 60 to 70 | 27.28 |
| 70 to 80 | 27.28 |
| 80 to 90 | 26.95 |
| 90 to 100 | 24.85 |
| Average Speed | 24.43 |
Now, Bolt is 6’5″ tall and lightning fast, so it’s not fair to compare him to your average Joe. To find the average human athlete’s speed, let’s first define who we’re talking about.
Defining who to classify as an average athlete
Picture this: you’re standing in a bustling city when suddenly someone snatches something from your hand and takes off running. Could you chase them down within 100 meters?
Now, let’s say this happens ten times, each time with a different thief. Some are quick, others not so much. They could be anyone you’d see in your local supermarket. If you can nab at least nine of these bandits while dressed in your running gear, I’d say you’re an average athlete.
How to gather data for calculating the average human athlete running speed
With our average athlete classification defined, let’s figure out where to pull data from. To do this, we need to ponder these questions:
- Should we include all Olympic athletes?
- Do we factor in the entire population, even those who’ve never trained to run?
- Should we rule out people over the age of 50?
To address these questions, we need to first answer the following 4 prelim questions:
- What’s the age range of the average athlete?
- What’s the fitness level of the average athlete?
- Which body types do average athletes have?
- What distance should the average athlete need to run?
I’ll answer each of these 4 questions using my own best reasoning. Then, we’ll be ready to gather the data for our calculations.
1. What’s the age range of the average athlete?
My age range kicks off in the late teen years, when both guys and gals hit puberty and their athletic abilities start to soar. By age 16, some kids are already playing pro sports alongside fully-grown adults.
I’ll put the age range cap at 80 because I believe that with regular training, you can maintain a respectable top speed until this age. Just take a look at the data from the World Masters Athletics in the graph below. The info comes from a 2009 outdoor competition showcasing the top 100-meter sprinters across various age groups.
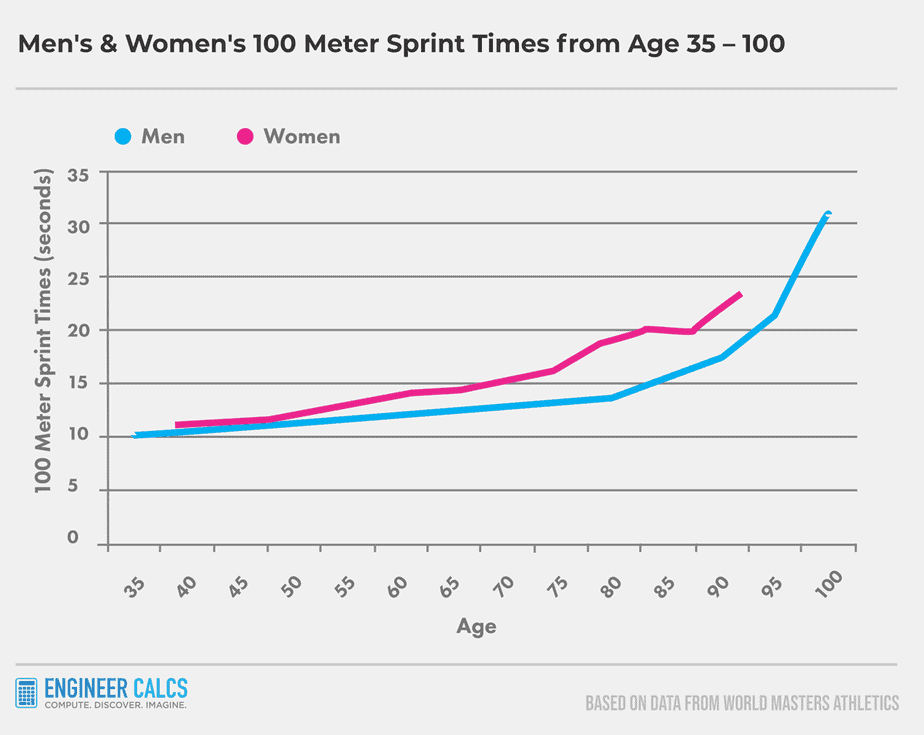
Once you pass 80, though, your speed takes a nosedive. You start to feel all sorts of aches and pains, especially if you’ve been hitting the gym your whole life.
So, data beyond age 80 represents extreme values, also known as outliers. For a precise analysis, I need to either use median values or ditch the outlier values. I decided to remove the outlier values from the mix.
2. What’s the fitness level of the average athlete?
Picture folks who’ve embraced fitness as a way of life. They hit the gym a few times a week and keep an eye on their diets. These are the exceptional performers within their age brackets.
Now, imagine if I wanted to find out how long people typically spend playing video games. I wouldn’t bother with non-gamers. Instead, I’d gather data from a 15-year-old teen and a 60-year-old man, assuming they both play.
3. Which body types do average athletes have?
I’m not about to narrow down our data to specific body types. Tall or short, lean or stocky, long or short torso – it doesn’t matter. My aim is to gather data from top runners across various age groups.
Keep in mind that the Olympics represents a select pool of body types, while high school sports showcase a broader and more diverse range. As you progress in a sport, certain body types tend to excel, all thanks to basic physics.
Of course, there are exceptions. Before Usain Bolt, shorter sprinters had the advantage when it came to speed. Most sprinters clocked in at about 5’10”, while Usain towers at 6’5″.
So, why does height matter when calculating human speed? To grasp this concept, let’s delve into how we determine speed.
It’s all about stride length times stride rate. The more strides you take in less time, the better you can harness the power of each step, propelling you forward.
Instinctively, shorter athletes often perform better in sprints. Taller athletes take longer strides, resulting in fewer steps and less opportunity to generate force with each one.
But there’s more to the story, which we’ll explore when we discuss Usain’s unique physiology.
4. What distance should the average athlete need to run?
A 100-meter dash is ideal, as it highlights peak human athletic performance. A 100-meter sprint also mirrors the speed you’d need if a bear were hot on your heels in the wild.
Sure, you won’t have perfect conditions in the wilderness like you would on a track. But whether escaping a bear or vying for a gold medal, you’re pushed to your limits. This extreme human output can only be captured in short bursts.
Now, let’s circle back to my definition of a runner. If someone swipes something from you, you’ll want to catch up with them within 100 meters.
Data collection on the average human athlete’s running speed
I’ve chosen 14 groups of runners who, while varying in speed, run at top speeds within their demographic group. Simultaneously, they meet all our criteria.
Group #1: High school male sprinters
- 100-meter time: 10.23 seconds
- Data from Athletic.net. 2019 national average of top 10 outdoor runs.
Group #2: High school female sprinters
- 100-meter time: 11.28 seconds
- Data from Athletic.net. 2019 national average of top 10 outdoor runs.
Group #3: College male sprinters
- 100-meter time: 9.99 seconds
- Data from Athletic.net. 2019 national average of top 10 outdoor runs.
Group #4: College female sprinters
- 100-meter time: 11.02 seconds
- Data from Athletic.net. 2019 national average of top 10 outdoor runs.
Group #5: Olympic male sprinters
- 100-meter time: 9.76 seconds
- Data from Wikipedia. All-time average of top 10 outdoor runs in the world.
Group #6: Olympic female sprinters
- 100-meter time: 10.70 seconds
- Data from Wikipedia. All-time average of top 10 outdoor runs in the world.
Group #7: 40 to 49 male sprinters
- 100-meter time: 11.26 seconds
- Data from XXIII 2018 World Masters Athletics Championships in Malaga. Average of top 10 outdoor runs.
Group #8: 40 to 49 female sprinters
- 100-meter time: 12.77 seconds
- Data from XXIII 2018 World Masters Athletics Championships in Malaga. Average of top 10 outdoor runs.
Group #9: 50 to 59 male sprinters
- 100-meter time: 11.88 seconds
- Data from XXIII 2018 World Masters Athletics Championships in Malaga. Average of top 10 outdoor runs.
Group #10: 50 to 59 female sprinters
- 100-meter time: 13.44 seconds
- Data from XXIII 2018 World Masters Athletics Championships in Malaga. Average of top 10 outdoor final runs.
Group #11: 60 to 69 male sprinters
- 100-meter time: 12.76 seconds
- Data from XXIII 2018 World Masters Athletics Championships in Malaga. Average of top 10 outdoor final runs.
Group #12: 60 to 69 female sprinters
- 100-meter time: 14.70 seconds
- Data from XXIII 2018 World Masters Athletics Championships in Malaga. Average of top 10 outdoor final runs.
Group #13: 70 to 79 male sprinters
- 100-meter time: 14.34
- Data from XXIII 2018 World Masters Athletics Championships in Malaga. Average of top 10 outdoor final runs.
Group #14: 70 to 79 female sprinters
- 100-meter time: 17.61 seconds
- Data from XXIII 2018 World Masters Athletics Championships in Malaga. Average of top 10 outdoor final runs.
Average human athlete running speed calculated
The calculated average human athlete running speed is 18.23 mph. Then breaking the data down, we calculate the following:
- Average male running speed: 19.52 mph
- Average female running speed: 17.12 mph
Compared to Usain Bolt’s speed of 27.8 mph, the average running speed pales in comparison. But even Bolt’s lightning-fast pace is no match for some of the wild animals out there.
Wild animal speeds compared to the average human athlete running speed
I’ve always been intrigued by the limits of human physical abilities. Throughout history, our ancestors relied on their speed to hunt prey and escape predators. It was a matter of life and death.
Nowadays, being fast is mostly relevant in athletics, all thanks to our rapidly evolving brains. But, can you picture our ancestors running after a wounded animal they’d struck with a spear? They had to be fast enough to finish the job.
Let’s stack up the top running speeds of some land animals against us humans:
| Animal | Animal's top speed | Usain Bolt's top speed | Usain Bolt's top relative to animal's top speed |
|---|---|---|---|
| Cheetah | 70 mph | 27.8 mph | 39.71% |
| Pronghorn Antelope | 61 mph | 27.8 mph | 45.57% |
| Lion | 50 mph | 27.8 mph | 55.60% |
| Wildebeest | 50 mph | 27.8 mph | 55.60% |
| Kangaroo | 44 mph | 27.8 mph | 63.18% |
| Coyote | 43 mph | 27.8 mph | 64.65% |
| Zebra | 40 mph | 27.8 mph | 69.50% |
| Hyena | 38 mph | 27.8 mph | 73.16% |
| Giraffe | 37 mph | 27.8 mph | 75.14% |
| Rhinoceros | 34 mph | 27.8 mph | 81.76% |
| African Elephant | 15.5 mph | 27.8 mph | 179.35% |
Clearly, we can’t hold a candle to the speed of most large land animals. But as we move into the future, who knows? We might just become the fastest and smartest species out there…
The science of speed: could humans run faster?
If our brains hadn’t evolved so much, would we be faster today? It’s possible…
Without our smarts, we’d need to outrun predators more frequently to survive. A 2010 study in the Journal of Applied Physiology explored the idea that humans could reach a top speed of 40 mph by applying greater force with each sprinting step. Physiologist Peter Weyand said:
“Despite how large the running forces can be, we found that the limbs are capable of applying much greater ground forces than those present during top-speed forward running.”
Breaking down human speed generation
Speed comes from the combination of stride length and stride rate. This is all about how hard and fast a runner pushes off the ground with each step. An Olympic sprinter can generate a total peak force of 1000 pounds with one foot, while an average person creates 500 to 600 pounds of total peak force.
An average person’s foot stays on the ground for 0.12 seconds when sprinting, compared to an Olympic sprinter’s 0.08 seconds. The sprinter generates 1000 pounds of total peak force at faster intervals, propelling them forward much quicker than the average runner.
This greater force is crucial when sprinters start a race, as they need to go from a standstill to full speed as quickly as possible.

How to make an Olympic sprinter even faster?
The key is to increase the amount of force a sprinter applies to the ground without lengthening ground contact time. This is tricky in short sprints because minimizing ground contact time is essential. The obvious solution is to enhance how fast muscle fibers contract and relax, allowing for greater forward force without increasing ground contact time. For example, reduce the 0.08 seconds each foot remains on the ground and, at the same time, achieve quicker contractions to generate greater force.
As a result, the total force output increases in a 100-meter run. The runner can generate their peak force more frequently. This is why physiologist Peter Weyand believes humans can reach a speed of 40 mph. He stated:
“If you just find a way to rev up those contractile fibers for the muscle, then everything else from human biology and gait would allow us to be that fast…”
Usain’s large body mass versus peak force
Usain’s imposing body mass means he has to work harder than a smaller sprinter to hit top speed. But thanks to his ability to generate more force with each stride, he leaves shorter sprinters in the dust. At the end of the day, sprinting is all about who can produce the most force in the shortest amount of time.
Check out these 10-meter segment splits from one of Usain’s legendary races, where he completed the 100-meter sprint in a jaw-dropping 9.69 seconds at the Beijing Olympics:
| Race Segments (meters) | Time (seconds) |
|---|---|
| 0 to 10 | 1.85 |
| 10 to 20 | 1.02 |
| 20 to 30 | 0.91 |
| 30 to 40 | 0.87 |
| 40 to 50 | 0.85 |
| 50 to 60 | 0.82 |
| 60 to 70 | 0.82 |
| 70 to 80 | 0.82 |
| 80 to 90 | 0.83 |
| 90 to 100 | 0.9 |
| Total Time | 9.69 |
What really blows my mind is how Usain maintains his top speed from 50 to 90 meters, showing off his amazing speed endurance. And let’s not forget, in that last 90 to 100-meter stretch, he thumped his chest and still clocked in at 0.9 seconds! It’s clear he could have maintained his top speed there too. Before this race, the fastest 10-meter segment in a 100-meter race was a measly 0.83 seconds.
The following year, Usain outdid himself with a new world record time of 9.58 seconds. Usain Bolt sprinted the 100 meters in 9.58 seconds, taking just 41 steps, while his opponents averaged 45 steps. As a result, Usain needed fewer steps to generate peak force due to his long strides. But, thanks to the greater force he generates with each step, he outperformed his competition.
It’s safe to assume that Usain probably has more fast-twitch muscle fibers than his rivals. This, combined with his long stride and towering 6’5″ frame, gave him that unbeatable edge.
Will evolution influence the running speed of future humans?
Whether we like it or not, human gene editing will soon produce the perfect athlete. We won’t need to wait tens of thousands of years for minor changes in the human body. Human biological evolution will take a backseat.
In the future, we could engineer the following attributes for humans in a lab:
- Faster contracting muscle fibers to boost forward running force
- Stronger bones and tendons to handle increased running force
- A restructured hip for more ideally positioned strides
- Enhanced oxygen processing ability
- Higher muscle density to optimize the body’s power-to-weight ratio
Undoubtedly, human speed would improve with these enhancements. However, we’d still lag behind a cheetah since we’re bipedal, using two legs to run, while the fastest land animals run on four legs.
The future of evolution and technology
With biotech advancements, we may even surpass a cheetah’s speed one day. Beyond gene editing, we might enhance our bodies with electromechanical components. A prime example is Oscar Pistorius, the South African sprinter from the London Olympic Games, who reached a speed of 25 mph using his prosthetic legs.
Prosthetic leg technology will undoubtedly advance over time. Furthermore, new tech will integrate with humans in ways we can’t even fathom today. We may be able to select our top speed straight out of a lab.
Will 100-meter world records even matter in the future?
Today, human bodies have physical limitations. Consequently, speed records also have limits without technological advancements. In the future, however, bionic bodies may only depend on money and ethics. If that’s the case, will world records even hold any significance?
We’d be as powerful as the Terminator, minus the apocalyptic killing spree. So, I can envision a day when a human races a cheetah and wins!

Humans becoming the fastest and smartest species on Earth
We’ve clocked the average human athlete at a running speed of 18.23 mph. While that might sound slow, considering we no longer rely on physical speed for survival, I’d say it’s pretty darn impressive. And let’s not forget, we humans have a leg up on most animals when it comes to long-distance running.
Back in our hunter-gatherer days, we roamed far and wide, hunting and foraging to stay alive. This lifestyle helped us develop some serious endurance, courtesy of evolution. Picture this: in the future, we could merge our exceptional endurance with mind-blowing short-distance speeds, transforming from mere mortals into bionic super-humans.
Zooming around at lightning speeds will be just another adrenaline-pumping adventure, like bungee jumping or skydiving! What an exhilarating future awaits us!
How do you think the average human athlete’s running speed stacks up against other animals? And with the help of advanced technology, how much faster do you reckon humans could run?
https://www.luxmyfurniture.com.au/forum/b5b05a-average-human-running-speed
^ This website has plagiarized content from this site. Just providing an indication. Google has allocated it as a featured snippet in some searches, so if you benefit from others viewing your content, then this may be redirecting others. The website (which seems to be the website of a real company, with a location on Google Maps) has chosen random lines from other sites looks rather sketchy, so be careful if visiting it.
Suspicious websites aside, I found this an interesting article! 🙂
I appreciate the heads-up.
Seems they’re spinning content, and doing a poor job at it too. They inserted my background in their article as well: “He has been working in the engineering and tech industry in California for well over 15 years now and is a licensed professional electrical engineer”…
This is average top human athlete running speed. Not average human running speed. You would need a random sample of 100 or so people sprinting to get average top human running speed. Your defined group isn’t equally represented here because you used only athletics data. That in itself is a significant filter since only athletically inclined people compete and athletes train ahead of competitions. If anything using highschool data only would be the closest to actual averages since there is less of a filter of who can compete… though still a significant one. The (future) college/olympic level athletes are (in theory) included in high school data but with less training and high school has less of the slower athletes filtered out.
Thank you, Lex, for your great comment. The article has been revised.